Tutorial Task 2.2 - Build an Output Collector
任务概述
在本教程中,您将创建一个用于记录各站点输出数据的统计收集器。本教程基于本系列教程一中使用的同一模型。关于如何加载模型的信息,请参考该教程:
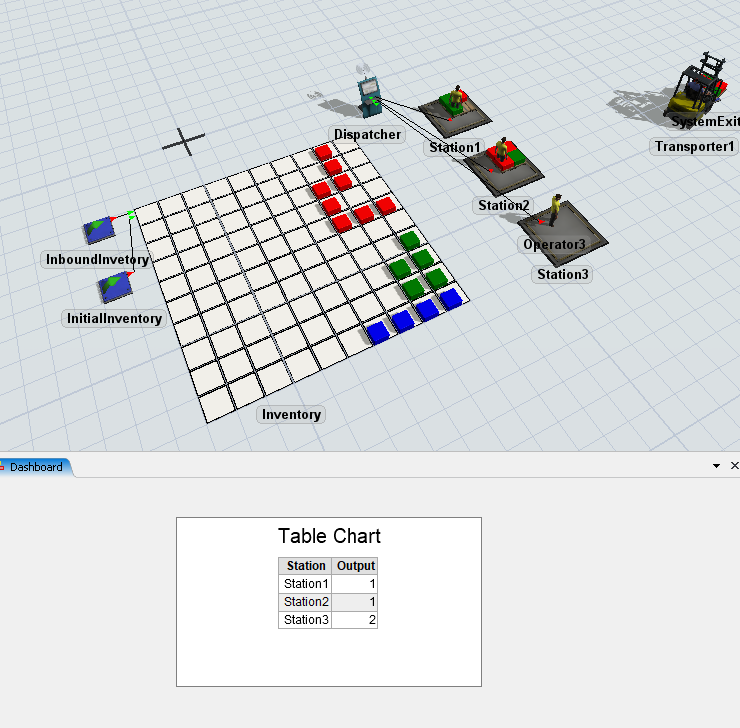
完成本教程后,您将获得一个新的统计收集器及图表,效果如下图所示。
步骤 1设置统计收集器
在此步骤中,您将创建并设置一个新的统计收集器。具体操作如下:
- 导航至屏幕左侧的工具箱选项卡。
- 点击
 按钮以创建新工具。进入统计选项区,选择统计收集器功能。此时应会为新统计收集器打开新的属性窗口。
 - 点击属性窗口顶部的字段,将统计收集器重命名为StationOutput
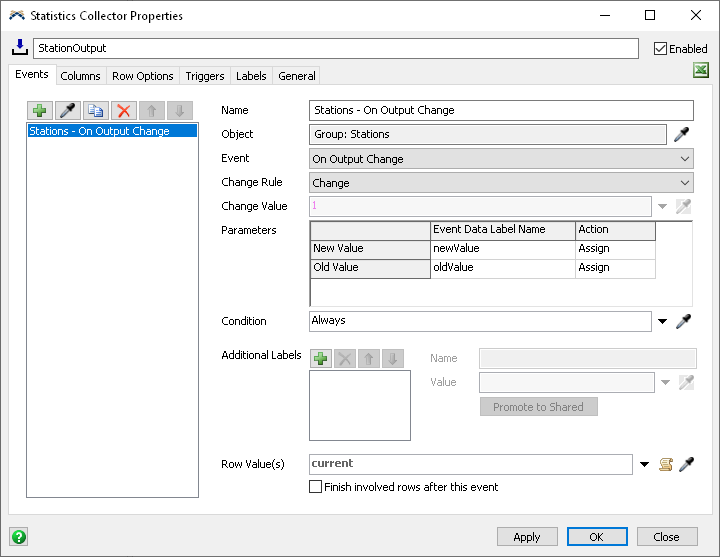
- 在事件标签页中,点击采样器按钮,然后在3D视图中点击Station1。
指向
 站点选项,然后选择输出变化时。在属性窗口中,点击
 - 行值旁边的三角形,并选择事件对象(当前)。导航到属性窗口中的
- 列标签页,并点击按钮,向StationOutput收集器的表格添加新列。点击
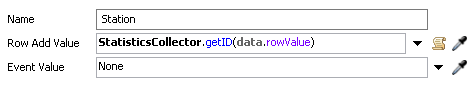
- 名称框,并将该列重命名为站点Station.
- 在行添加值框旁边,选择箭头以打开下拉列表选项。选择ID类别,然后选择行值ID选项。
- 点击按钮以添加新列。
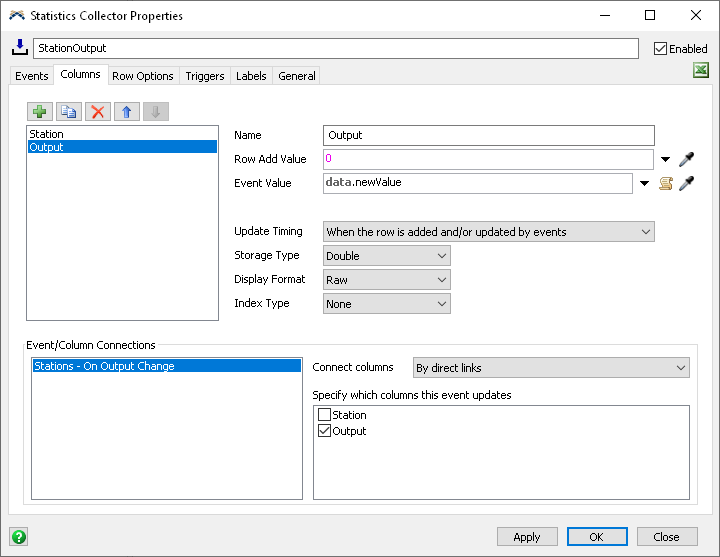
- 点击名称框,将此列重命名为输出
- 点击行添加值框,并输入
0。在这种情况下,我们希望添加行时 输出的值为0,但我们将在 事件值框中获取站点的实际输出。 - 点击事件值方框并键入
数据。新值。 - 要建立列/事件连接,请点击事件/列连接字段中的站点 - 输出变更时选项,然后在标有指定此事件更新的列的字段中勾选输出
- 方框。最后,我们可以点击存储类型字段并选择整数
- 选项。应用按钮。
这将使用在输出变更时事件参数上创建的标签,该参数会查看事件触发时的新值。在这种情况下,新值指的是站点的输出。
重置并运行模型。如果右键点击StationOutput收集器对象在您的工具箱标签页中,并选择查看表格
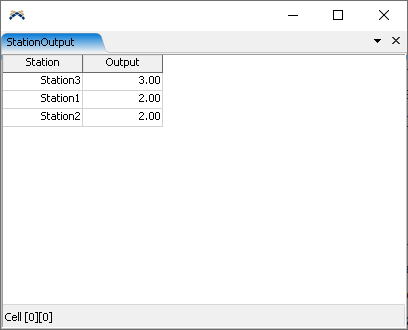
,您将能够看到统计收集器的表格为每个站点更新。
解释
监听一个组
统计收集器可以监听一组对象。如果组中的任何对象触发事件,统计收集器将响应该事件。在此任务中,您监听了 Stations 组中所有对象的 On Output Change 事件。这意味着如果任何站点触发其 On Output Change 事件,那么统计收集器将响应。
事件参数当您监听一个对象事件时,该事件可能带有参数。在此示例中,您监听了 On Output Change 事件,该事件有两个参数:输出统计的新值和旧值。这些参数被分配为实体。在此任务中,您使用了数据。newValue用于输出列的值中。newValue是输出变更事件的参数,并在数据对象上被赋予标签。
使用current
在统计收集器中,关键字current指的是触发事件的对象。当任何站点触发其输出变更事件时,current将指代触发事件的站点。
连接事件与列
您可以将一个事件连接到一个或多个列。当事件触发并产生其行值时,统计收集器将确保存在该值的行。然后,对于每个连接的列,统计收集器将记录事件值在当前行的该列中。在此任务中,您已将“输出变化”事件连接到输出列。当某个站点的输出发生变化时,统计收集器将确保为该站点创建一行,然后将新的输出值写入输出列。
存储类型
统计收集器允许您控制每列所需的内存大小。在此任务中,您将存储类型设置为整数。这意味着该字段将只能存储整数值,但它所需的内存将少于双精度列。
步骤 2设置站点的显示顺序
目前,统计收集器会在每个站点的输出首次发生变化时为其添加一行。这意味着表格中的行顺序取决于模型的运行方式。
要解决此问题:
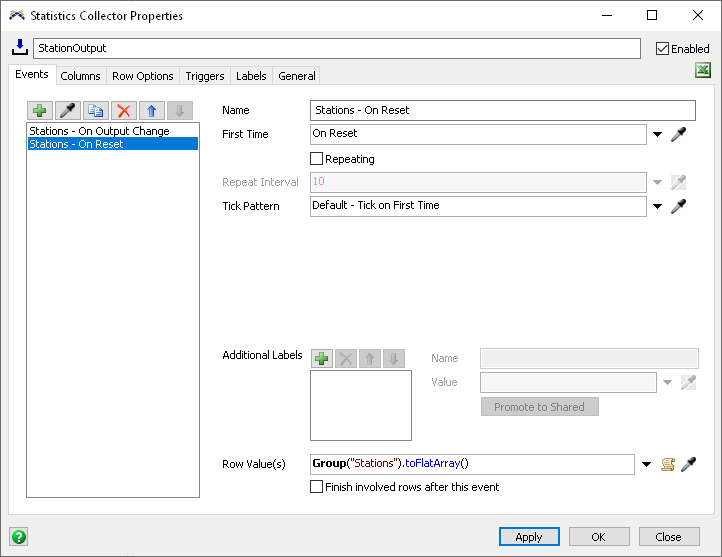
- 再次导航到统计收集器的属性窗口,并转到事件标签页。
- 点击按钮以添加新事件,并选择创建重置事件选项。
- 点击名称框,将事件重命名为站点 - 重置时
- 点击行值框旁边的箭头,然后选择组的所有成员选项,接着选择站点组。
- 点击应用按钮。
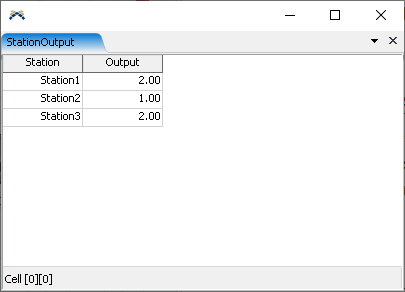
如果现在重置并运行模型,您可以查看表格,应该会看到站点输出收集器的表格已正确排序了站点。
说明
当"站点-重置时"事件触发时,它会生成一个包含站点组中所有对象的数组。这些对象的顺序与组属性窗口中显示的顺序一致。随后,当"站点-输出变更"事件触发时,由于该站点对应的数据行已存在,统计收集器不会新增数据行。但该事件已关联至输出列,因此该站点对应行的输出列将被更新。
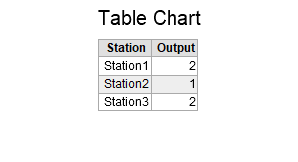
步骤3在仪表板中添加表格图表
接下来我们将在仪表板中添加一个简单的表格来展示输出数据。完成后,表格应呈现如下样式。
创建图表的步骤如下:
- 点击屏幕顶部的仪表板按钮,并选择添加仪表板选项。
- 在右侧属性面板中,点击仪表板名称输入框。将仪表板重命名为站点输出。
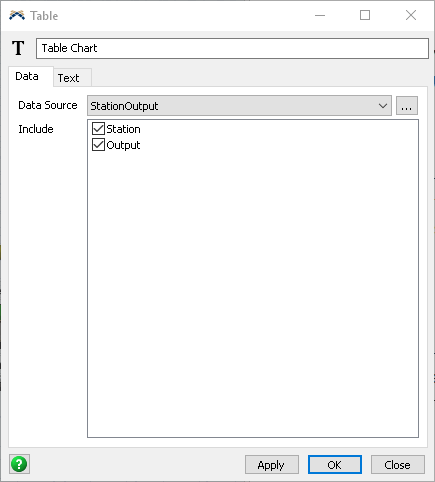
- 在仪表板视图处于激活状态时,浏览左侧资源库。找到对应选项表格图表在基础图表类型类别下,将一个表格图表拖入仪表板窗口。这将创建一个新的空白图表,并打开其属性窗口。
- 在属性窗口中,点击数据源字段,并从选项中选择StationOutput收集器。
- 在包含字段中,确保已勾选Station和Output复选框。
如果您重置并运行模型,现在可以看到表格图表将跟踪站点输出。您可能需要以更高的速度运行模型才能看到这一变化。
在下一个任务中,我们将使用统计收集器来显示站点内容随时间的变化。
Cookie preferences
May we collect and use your data?
Learn more about the Third Party Services we use and our Privacy Statement.THIRD PARTY SERVICES
Strictly necessary – required for our site to work and to provide services to you
Improve your experience – allows us to show you what is relevant to you
Customize your advertising – permits us to offer targeted advertising to you
Are you sure you want a less customized experience?
Your experience. Your choice.
May we collect and use your data to tailor your experience?
Explore the benefits of a customized experience by managing your privacy settings for this site or visit our Privacy Statement to learn more about your options.
 微信扫一扫,打赏作者吧~